Enterprise Performance Management (EPM)
What
is enterprise performance management?
Enterprise
Performance Management (EPM) software helps you analyze, understand, and report
on your business. EPM refers to the processes designed to help
organizations plan, budget, forecast, and report on
business performance as well as consolidate and finalize financial results (often
referred to as “closing the books”). EPM solutions are primarily used by CFOs
and the office of finance, while other functional areas, such as HR,
sales, marketing, and IT, use EPM for operational planning, budgeting, and
reporting.
The
EPM cycle

While
often tied to enterprise resource planning Enterprise Resource Planning systems,
EPM software complements ERP by providing management insights in addition to
top of operational data. In other words, ERP is about operating the
business—the day-to-day transactional activity—and EPM is about managing the
business—analyzing, understanding, and reporting on the business.
Today,
EPM software is considered to be critical for managing all types of
organizations by linking financial and operational metrics to insights—and
ultimately driving strategies, plans, and execution. With EPM software,
managers can drive improved performance across the organization by monitoring
financial and operational results against forecasts and goals and using
analytics to recognize key trends and predict outcomes.
In
an environment of constant change, new competitors, and economic uncertainty,
EPM offers a tool for organizations to manage their agile businesses. With
finance at the helm, EPM business processes (strategic modeling,
plan, consolidate and close, report, and analyze performance) can help
organizations understand their data and use it to make better business decisions.
Business
value of EPM software—critical in uncertain times
The
key to surviving disruption is flexibility. Whether the disruption comes from
outside forces (such as new regulations or global weather events) or market
realities (one product skyrockets to success while another flops),
organizations that respond quickly are able to stay ahead of the curve. A
modern EPM solution enables you to understand how, when, and where to adjust to
disruptions.
Optimize
the financial close In a changing regulatory environment, you need to adapt
quickly to new requirements and deliver faster, more accurate insights to all
stakeholders. EPM helps you streamline the financial close and report with
confidence and insight.
Streamline
account reconciliation Account reconciliation is the number one reason for
non-data-related delays in the financial close. EPM enables you to efficiently
manage and improve global account reconciliation by exploiting automation and
comprehensively addressing the security and risk typically associated with this
process.
Drive
accurate and agile integrated plans—The digital economy demands more than
spreadsheets and department-oriented planning processes. Truly effective
planning should seamlessly connect your entire organization for a better vision.
With EPM you can align planning across the enterprise, so that you can develop
agile forecasts for all lines of business and respond faster and more
effectively to change.
Manage
and drive profitability—To survive in uncertain times, you must be able to
manage and drive profitability. EPM helps you gain insight into dimensions of
cost and profitability to determine where to invest limited resources.
Align
tax reporting with corporate financial reporting—Changing tax laws are causing
global organizations to plan and manage their tax affairs very differently than
they have to-date. EPM supports effective tax reporting by connecting the
processes, data, and metadata that tax and finance share, such as financial
planning, financial close, and regulatory reporting.
Satisfy
all your reporting requirements—No matter how many reporting standards you have
to comply with, you want to be sure that the data you provide in your reports
is accurate, complete, and the most current information available. EPM reduces
the need for multiple reporting systems.
Manage
change with enterprise data management—Whether you're migrating applications to
the cloud, managing applications in a hybrid environment, or spearheading major
business and financial transformation, an enterprise data management
platform provides data accuracy and integrity with the alignment of your
data and master data.
Next-generation
EPM—analysis to action
Historically,
EPM systems have focused on transitioning finance from spreadsheets to more
robust solutions that let teams spend less time on low-value tasks such as data
manipulation and reconciliations and more time on high-value tasks like
analysis. But even after making the move from spreadsheets, there’s still too
much time between analysis and action.
Enter
the next generation of EPM, which has new capabilities that incorporate
emerging technologies, such as artificial intelligence and machine learning.
These technologies are powerful decision-making tools because they close the
gap between analysis and action. They help improve the quality of decisions
made by finance managers and executives by detecting hidden patterns and
insights in historic data. The impact on decision-making is widespread, from
tactical (which vendor to pay first) to operational (budget reallocations) to
strategic (mergers and acquisitions).
Beyond
decision-making, these technologies can automate routine tasks to eliminate
manual labor and reduce the likelihood of errors. There are many tasks in the
financial close and reconciliation process that fall into this category. This
type of automation will free up valuable time for finance professionals to
engage with operations and spend more time providing the forward-looking
guidance that management needs to capitalize on the next opportunity.
Enterprise
Performance Management (EPM) is the process of monitoring performance
across the enterprise with the goal of improving business performance. An EPM
system integrates and analyzes data from many sources, including, but not
limited to, e-commerce systems, front-office and back-office applications, data
warehouses and external data sources. Advanced EPM systems can support many
performance methodologies such as the balanced scorecard.
History
of EPM
The
concept of EPM has been around for decades. Before computers, EPM processes and
solutions were managed manually via meetings, phone calls, and discussions. In
the 1970s, the first EPM software applications became available and accounting
solutions began collecting budgeting and financial information for reporting
purposes. Spreadsheets were introduced in the 1980s with software such as
Lotus1-2-3 and VisiCalc. Spreadsheets allowed finance teams to automate budget
and report creation and replace manual worksheets. The availability of email in
the 1990s allowed people to share spreadsheets, which led to better
collaboration and collection of budgeting and reporting data. Around the same
time, the first EPM software packages began to automate the financial
consolidation and reporting process. These products included: IMRS Micro
Control (which later became Hyperion software), Hyperion Enterprise for
financial consolidation and reporting, and Hyperion Pillar for planning
processes.
EPM
today—from
on-premises to the cloud
Over
the past couple of decades, EPM software platforms evolved from Windows-based
client/server systems to internet-enabled, web browser-based applications.
Today, there’s an increasing demand for cloud-based EPM software, also known as
software as a service (SaaS). When EPM software is “in the cloud” it simply
means that the application is housed on a network of remote servers, instead of
at a company’s location.
The
cloud offers a more affordable alternative for EPM that lowers both operational
expenses and capital expenses, because it eliminates the need for companies to
purchase software and hardware or hire additional IT staff. With no costly
infrastructure to support, resources can be invested in growth opportunities,
while employees can focus on more value-added tasks instead of managing IT.
Next-generation
EPM—analysis
to action
Historically,
EPM systems have focused on transitioning finance from spreadsheets to more
robust solutions that let teams spend less time on low-value tasks such as data
manipulation and reconciliations and more time on high-value tasks like
analysis. But even after making the move from spreadsheets, there’s still too
much time between analysis and action.
Enter
the next generation of EPM, which has new capabilities that incorporate
emerging technologies, such as artificial intelligence and machine learning.
These technologies are powerful decision-making tools because they close the
gap between analysis and action. They help improve the quality of decisions
made by finance managers and executives by detecting hidden patterns and
insights in historic data. The impact on decision-making is widespread, from
tactical (which vendor to pay first) to operational (budget reallocations) to
strategic (mergers and acquisitions).
Beyond
decision-making, these technologies can automate routine tasks to eliminate
manual labor and reduce the likelihood of errors. There are many tasks in the
financial close and reconciliation process that fall into this category. This
type of automation will free up valuable time for finance professionals to
engage with operations and spend more time providing the forward-looking
guidance that management needs to capitalize on the next opportunity.

What is Enterprise Performance
Management (EPM)?
Enterprise
Performance Management, more commonly referred to as EPM, is a type of business
planning used by a wide range of entities that involves the evaluation and
management of an enterprise’s performance and ability to reach goals, increase
efficiency, and maximize business processes. EPM drives the improved
performance of an enterprise by comparing its results to its forecasts and
goals.
The
concept of EPM has existed for decades, spanning back to the Industrial
Revolution as businesses then sought to automate processes to maximize their efficiency
and increase their bottom line. In the 1970s the first rudimentary EPM software
was implemented, paving the way to where we are now. EPM in the present makes
the most out of today’s technology through the use of on-premises and cloud
software systems to aggregate and analyze data.
EPM
business processes
The
business processes associated with EPM can be broken down into five functional
areas: Strategic modeling, planning and budgeting, close and
consolidation, reporting, and performance analytics. Read on for an overview of
each of these areas.
Strategic
modeling
Strategic
modeling allows users the opportunity to develop long-range strategic forecast
models. It is useful for detailed forecasting and analysis of trends and frees
up time spent on manually gathering data. Strategic modeling gives users a
sense of confidence in the accuracy of their projections, reports, and audits.
Planning
and budgeting
Using
EPM software for planning and budgeting gives users flexibility and
scalability with their forecasts. While standard EPM products include
out-of-the-box planning content, others, such as Oracle EPM, go a step
further and provide the user with the ability to create custom parameters for
future planning and budgeting.
Close
and consolidation
EPM
software can be used for streamlining financial close and consolidation, making
it easy for users to report on their business with confidence. This support
gives users peace of mind when it comes to meeting global regulatory
requirements and provides the requisite transparency of data for
stakeholders both internal and external.
Reporting
Financial
reporting has been revolutionized by EPM software. It provides a format for
neat, consistent, standardized reporting. EPM software can be used to
consolidate briefs into executive reports, distribute report content to
stakeholders, and integrate financial decisions, among other functionalities.
Performance
analytics
Analyzing
past performance is made easier and more accurate than ever before with EPM
technology. EPM technology is used to conveniently analyze trends across years,
divisions, and against planned performance. This data creates a holistic
picture of the enterprise that is invaluable for leadership, management, and
stakeholders.
Why
do we need EPM?
With
EPM you can align planning across the enterprise, so that you can develop
agile forecasts for all lines of business and respond faster and more
effectively to change. Manage and drive profitability—To survive in uncertain
times, you must be able to manage and drive profitability.
What
are the components of EPM?
Some
of the key components of EPM systems include planning, budgeting, and
forecasting capabilities and the ability to monitor KPIs, provide analysis, and
manage reporting.
Effective
enterprise performance management (EPM) is the key to business success. Having
a great business strategy is only the first step to growing a sustainable
business. You also need clearly defined objectives and effective processes that
provide structure and direction in achieving those goals. But, perhaps
even more importantly, you need a system for tracking.
Effective
enterprise performance management (EPM) is the key to business success.
Having
a great business strategy is only the first step to growing a sustainable
business. You also need clearly defined objectives and effective processes that
provide structure and direction in achieving those goals.
But,
perhaps even more importantly, you need a system for tracking and measuring
performance so you can continue to improve performance.
To
paraphrase management guru Peter Drucker, you can’t manage what you don’t
measure.
A
big challenge for any business is balancing the long-term strategic priorities
of the business with short-term operational priorities. Failing to balance strategic
and operational needs leads to organizations underperforming.
If
too much focus is given to immediate operational concerns, strategic objectives
fall by the wayside. Similarly, if all the focus is on the big goals, critical
operational issues often aren’t recognized and addressed in time. This can
result in delays, under-resourcing, and high employee turnover.
This
balancing act is part of the job for execs and managers. It’s made easier with
the right management system.
In
this article, we’ll explore how an enterprise performance management system
enables managers to translate strategic priorities into operational actions and
to measure—and improve—the effectiveness of both.
Enterprise
performance management (EPM) refers to the systems and processes involved in
setting strategic business goals, translating these goals into measurable
objectives, planning operations and allocating resources, and tracking
enterprise performance against these goals.
EPM
involves actively collecting and analyzing data to report on past performance,
forecast future success and failure scenarios, and plan and implement strategic
interventions to continuously improve performance.
On
a strategic level, EPM is the domain of decision-making executives—CFOs in
particular. It is used for operational planning, budgeting, and KPI tracking
and reporting by units or departments throughout the organization. This
includes human resources, I.T., product, marketing, sales, customer service,
and finance teams.
Enterprise
performance management is also sometimes referred to as business performance
management (BPM), corporate performance management (CPM), and financial
planning and analysis (FP&A).
EPM
vs enterprise resource planning (ERP)
While
EPM is often in conjunction with ERP, they are not interchangeable.
ERP,
enabled through ERP systems, covers the day-to-day transactional
activities involved in managing operations. EPM analysis goes beyond
operational data to provide an extra layer of managerial insights to help
inform strategy decisions.
Benefits
of enterprise performance management
At
its core, the function of enterprise performance management is to improve
organizational efficiency by balancing high-level business strategy with
operational performance.
This
clarity of purpose offers employees throughout the organization increased
stability and a greater sense of direction and unity—which in turn translates
into better strategic alignment across departments.
Improved
business intelligence
By
setting clear goals and actively tracking performance against key performance
indicators (KPIs) across the organization, managers and teams have a cohesive
view of the current status of the business.
This
data empowers management to run projections, identify opportunities and
threats, and make informed decisions to improve efficiency and profitability.
Improved
profitability
By
continuously monitoring the business’s financial performance and tracking
margins, EPM can help business leaders to predict the profitability of future
initiatives and scenarios.
This
enables them to adjust their strategy to take advantage of opportunities and
avoid pitfalls, removing inefficiencies and maximizing returns.
Greater
regulatory oversight and compliance
Accurate,
real-time data from touch points throughout the business makes it easier to
ensure regulatory compliance.
Many
modern EPM systems offer features that assist companies to generate detailed
reports. This makes financial close easier by automating corporate financial
reporting and tax reporting.
Streamlined
financial processes
By
promoting detailed expenditure projections, EPM facilitates better financial
planning and analysis, resulting in more accurate budgets.
With
process automation and continuous tracking, EPM streamlines financial consolidation
by removing a lot of the time-consuming admin. It also reduces errors from the
process of reconciling the books for financial close.
The
enterprise performance management process
Here’s
how the EPM process typically looks:
1.
Consult data from all business units
Detailed,
up-to-date data enables businesses to make strategic planning decisions based
on past performance and informed projections. The more of your business
processes that are digitized and automated, the easier it will be to consolidate
this data. EPM software with decent data analytics capabilities will help you
create realistic forecasting models based on past performance data.
2.
Develop a strategy
After
analyzing the data, identify new strategic performance goals that will improve
the organization’s performance and profitability. The more specific you can be
about the desired outcomes and the actions needed to achieve them, the better.
Create clear objectives and define metrics or KPIs with which to track
them.
3.
Budget and resource
Create
a detailed plan (with some flexibility built-in) describing the capital and
resources required to execute the initiatives described in your strategy. Once
again, data from previous years will help inform this process. However, be sure
to consult key unit stakeholders to collaboratively establish accurate costing
estimates, especially for new (previously unseen) projects.
4.
Execute, track, and report
Continuously
track performance across all units of your organization using pre-defined
metrics that measure whether initiatives are in alignment with the company’s
strategic goals. Prepare scorecards and reports that make it easy to identify
successes, shortfalls, bottlenecks, and other key information that can help
determine whether strategy or workflow adjustments are needed. Explore our
comprehensive guide on performance review phrases to enhance your feedback
sessions.
Analyze
and assess
Review
your reports to see how well the company’s performance aligned with its
strategic goals. Identify opportunities for improvement and investigate the
root causes of underperforming areas. Use this business intelligence to drive
and inform your strategy for the next cycle.
Enterprise
performance management is an iterative process, meaning it is likely to take a few
cycles to get it right.
One
of the common pitfalls many companies fall into is failing to translate their
ambitious goals into specific targets and actions that managers can understand,
execute, and measure effectively.
To
help with this, Liz Lockhart’s article on cascading goals is a great
place to start.
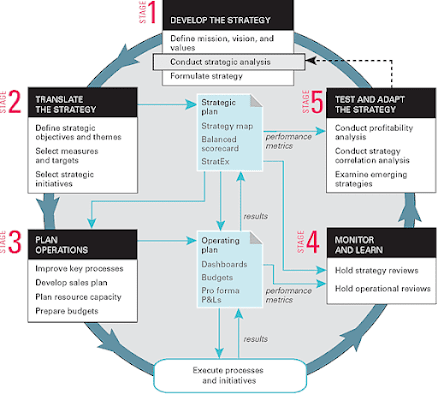
If
you’d like to dive into enterprise performance management in more detail, have
a look at the closed-loop management system developed by Robert S.
Kaplan and David P. Norton.
Published
in HBR in 2008, it’s slightly dated now (i.e. it doesn’t take into
account the data analytics capabilities of the software available today), but
it’s still a compelling read and the strategic insights it contains are
solid.
How
do you manage business performance?
Businesses
across all industries benefit from implementing proper enterprise performance
management. Of course, needs will vary and organizations will enter at
different starting points.
Business
leaders today have the distinct advantage of technologies that use machine
learning help to automate much of the heavy lifting when it comes to reporting,
data analysis, and forecasting.
It’s
just a matter of selecting the right EPM solution for the job.
To
see what options are available, and choose the right solution for your
business, check out our pick of the best enterprise performance management
software on the market today.
What
is the difference between management controls and operational controls?
Strategic
control involves monitoring and adjusting an organization's overall
strategy to ensure that it is aligned with its mission and
objectives. Operational control, on the other hand, involves the
day-to-day management of the organization's operations to ensure they are
efficient and effective. In summary, strategic control deals with long-term
goals and direction while operational control deals with the current
performance and execution of tasks.
|
Strategic
Control |
Operational
Control |
|
Long-term
focus and goals |
Short-term
focus and specific tasks |
|
Top-level
management is responsible |
Middle/lower-level
management is responsible |
|
Broad
scope and strategic perspective |
Narrow
scope and operational perspective |
|
Evaluates
overall performance and progress towards long-term goals |
Monitors
day-to-day performance and progress towards specific tasks |
|
Looks
at external factors such as market trends and competition |
Looks
at internal factors such as resources and efficiency |
|
Uses
financial metrics such as return on investment and profitability |
Uses
operational metrics such as productivity and quality control |
|
Involves
making strategic decisions such as entering new markets or developing new
products |
Involves
implementing decisions made at higher levels, such as how to manufacture a
product efficiently |
|
Example:
Deciding to enter a new market or developing a new product |
Example:
Deciding how to manufacture a product efficiently or managing inventory
levels |
Key
differences between Strategic Control and Operational Control
Strategic
control focuses on the long-term goals and objectives of an organization, while
operational control focuses on the day-to-day management of the organization's
operations.
Strategic
control involves setting overall direction for the organization, while
operational control involves ensuring that the organization's operations are
executed efficiently and effectively.
Strategic
control involves making decisions at a higher level of management, while
operational control involves making decisions at a lower level of management.
Strategic
control involves monitoring the organization's external environment, while
operational control involves monitoring the organization's internal operations.
Strategic
control is typically the responsibility of top management, while operational
control is typically the responsibility of middle and lower management.
Strategic
control focuses on the overall performance of the organization, while
operational control focuses on the performance of specific departments or
functions.
Strategic
control involves making decisions about resource allocation, while operational
control involves managing the use of those resources.
Strategic
control is more forward-looking, while operational control is more focused on
the present.
Management
controls: The security controls that focus on the management of risk and the
management of information system security. Operational controls: The security
controls that are primarily implemented and executed by people.
What
Strategic Control does?

Steps
for Operational Control

- Set performance standards
- Measure actual performance
- Identify deviations (if any)
- Introduce corrective actions
The
focus of operational control is on the result of the strategic action, which
assesses the overall organization’s performance, different SBU’s and other
divisions and units.
Techniques
used for Operational Control
- Financial Techniques
- Network Techniques
- Management by Objectives
- Memorandum of Understanding
Financial
performance measures a firm's financial health based on assets,
liabilities, revenue, expenses, equity, and profitability. It is a thorough
analysis of company financial statements. Analysts examine a firm's Income
Statement, Cash Flow Statement, Balance Sheet, and Annual Report.
The
overall performance and position of the business should be evaluated based on a
set of criteria that includes liquidity, solvency, profitability,
financial efficiency, and repayment capacity. Each of these criteria measures a
different aspect of financial performance and/or position.
financial
performance measures an organization’s ability to manage finances. It is
evaluated based on a firm’s assets, liabilities, revenue, expenses, equity, and
profitability.
Financial
ratios serve as crucial indicators. It measures firms’ financial well-being
using data provided in financial statements.
Financial
performance metrics include quick ratio, current ratio, working capital, gross
profit margin, net profit margin, equity multiplier, debt-to-equity ratio,
return on equity, return on asset, total asset turnover, inventory turnover,
and operating cash flow.

Reduce
Costs
An
EPM suite can be costly, but considering all the data it brings together from
various departments in real time, its value is immense. Using modular solutions
with an open architecture gives you the same functionality, with the option to
integrate desired applications. You can view the per-project budget allocation
by connecting your budgeting and accounting systems with project management
software.
Upscaling
is easier with a single solution to learn. And automation drives efficient
workflows, saving resources, money and time.
Accelerates
Data Analysis
A
centralized interface gives access to unique, accurate and reliable data with
no risk of data duplication. Faster information retrieval translates to
speedier data analysis. Collaboration is possible through shared real-time
visualizations, team chats and comments. Having the latest data results at hand
gives you confidence in your decisions.
Data
science techniques like artificial intelligence and natural language processing
help identify patterns in multi-departmental data. Knowing what’s working and
what’s not can impact strategy restructuring and budgeting.
Improve
Reporting and Planning
EPM
software is an all-in-one budgeting, accounting and financial reporting system.
It has built-in standard reports like income and cash flow statements that help
you hit the ground running without IT help. Financial accounting software
allows you to track expenses and earnings, oversee payroll management and
keep tabs on goals and investments.
When
you know your business inside out, you can pinpoint how to improve it. Business
intelligence is still a part of most EPM offerings. Corporate planning is
easier with a clear picture of your core operations with their strengths and
weaknesses.
Boost
Efficiency
Automating
data aggregation saves time, letting you focus on performance analysis and
planning. Cloud-based software allows you to stay informed and perform tasks
remotely from any device. Create scripts to perform various tasks and automate
their execution using a scheduler.
Besides
scheduled uploads, administrators can automate reconciliation, profitability
and cost management, and financial close and consolidation workflows. Others
include data management, user provisioning and audit reporting.
Enhance
Customer Service
Designed
for your core operations, EPM provides robust back-end support to
customer-facing processes. Companies perform better with seamless supply
chain, inventory, and workforce management behind the scenes.
EPM highlights improvement areas and top-performing KPIs, bringing to the fore
your marketing, sales and customer processes for review and analysis.
Financial
Performance Analysis
Performance
analysis is the study of company financial statements —to discover a
firm’s strengths and weaknesses. It also involves the comparative analysis of a
company’s overall financial health. Company performance in a current fiscal
year is compared to previous periods and competitors’ performance.
The
different areas of financial performance analysis are as follows:
Profitability
Analysis: Owners, managers, investors, shareholders, and creditors use profitability
ratios. It helps determine a firm’s business performance and profit earning
ability.
Working
Capital Analysis: Analysts study firms’ operational efficiency to ensure that
the firm does not run out of current assets—required to meet short-term
obligations.
Activity
Analysis: This comprises the evaluation of a company’s production process,
human resource requirements, time taken, raw materials consumed, and
value creation. Activity analyses are undertaken to boost productivity and to
streamline business operations.
Financial
Structure Analysis: The interpretation of the business capital structure is
essential to balance the firm’s debt and equity proportion.
Indicators
The
financial performance of any business can be gauged through various financial
ratios that indicate a firm’s liquidity, profitability,
leverage, and market value.
Prominent
financial performance metrics are as follows:
1.
Gross Profit Margin: The ratio determines firms’ profitability before
considering the operating expenses. Its formula is as follows:
Ø
Gross
Profit Margin = [(Revenue – Cost of Goods Sold) / Revenue] × 100.
2.
Net Profit Margin: The net profit ratio is another financial
performance metric. It measures firms’ profitability after deducting all the
expenses from gross profits. It is evaluated as follows:
Ø
Net
Profit Margin = (Net Profit / Revenue) × 100.
3.
Return On Equity: It is a profitability measure that ascertains a firm’s
ability to generate profit from equity capital that was acquired from
the shareholders. It is represented by:
Ø
Return
on Equity = Net Profit / [(Beginning Equity + Ending Equity) / 2].
4.
Return On Asset: This profitability ratio determines a firm’s ability to
utilize assets efficiently to generate profits. Its formula is as follows:
Ø
Return
On Asset = Net Profit / [(Beginning Total Assets + Ending Total Assets) / 2].
5.
Quick Ratio: It is a liquidity metric; it analyzes firms’ ability to clear
short-term liabilities using cash and cash equivalents. Its formula is as
follows:
Ø
Quick
Ratio = (Current Assets – Inventory) / Current Liabilities.
6.
Current Ratio: It measures firms’ liquidity. It evaluates a firm’s ability to
pay off short-term liabilities (using current assets). It is determined as
follows:
Ø
Current
Ratio = Current Assets / Current Liabilities.
7.
Working Capital: It gives an overview of a company’s operational
liquidity—whether a firm is efficient in handling business operations. It
is evaluated as follows:
Ø
Working
Capital = Current Assets – Current Liabilities.
8.
Operating Cash Flow: Cash flow is a good indication of a firm’s
financial performance. This ratio analyzes a company’s efficiency in
maintaining a positive cash flow. This data can be acquired from companies’
cash flow statements—it can be positive or negative.
9.
Debt Asset Ratio: It is a leverage ratio; it measures a firm’s ability to
fulfill its short-term obligations, long-term obligations, and debts. This ratio
considers companies’ overall assets as the criteria. It is computed as follows:
Ø
Debt
Asset Ratio = Total Debt / Total Assets.
10.
Debt-To-Equity Ratio: It is a liquidity indicator; it is evaluated as the
proportion of external liability to internal equity. It is computed as
follows:
Ø
Debt-to-Equity
Ratio = Total Debt / Total Equity.
11.
Equity Multiplier: It is a proportion of assets to shareholders’ equity.
It indicates how much equity and debt was used to buy a particular asset. It is
represented by:
Ø
Leverage
= Total Assets / Total Equity.
12.
Total Asset Turnover: It measures the maximum net sales generated by
a business when it employs all its assets. It is computed as follows:
Ø
Total
Asset Turnover = Net Sales / Total Sales.
13.
Inventory Turnover: This ratio measures companies’ ability to convert stock
into sales:
Ø
Inventory
Turnover = Cost of Inventory Sold / Average Inventory.
14.
Accounts Receivable Turnover: It gauges firms’ efficiency in recovering
outstanding credit (sales) from the debtors. It is evaluated as follows:
Ø
Accounts
Receivable Turnover = Net Credit Sales / Average Accounts Receivables.
15.
Accounts Payable Turnover: This indicator evaluates a company’s ability to
repay creditors (goods purchased on credit). It is calculated as
follows:
Ø
Accounts
Payable Turnover = Net Credit Purchase / Average Accounts Payable.
Measures
of financial performance reduce a large amount of information into a convenient
form for analysis. No single measure of financial performance is adequate for
evaluating a farm business. Evaluation of several financial measures may be
more useful in directing the manager to ask the right questions than in
providing solutions to the financial problems of the business. Both the
magnitude of the measure and its relationship to other measures should be
evaluated.
Decisions
made in developing the balance sheet, cash flow statement, and income statement
have important impacts on the financial measures discussed in this OSU
Extension Fact Sheet. Some of those decisions include using cost or market
values in preparing the balance sheet; determining a specific value for each
asset and liability on the balance sheet; including or excluding accrued
expenses, deferred taxes, and personal assets and liabilities from the balance
sheet; estimating net income on a cash, accrual, or accrual adjusted basis; and
deciding if income should be before or after taxes. Each of these decisions
affects key relationships in the financial statements and impacts the financial
measures used to evaluate financial performance and position.
The
overall performance and position of the business should be evaluated based on a
set of criteria that includes liquidity, solvency, profitability, financial
efficiency, and repayment capacity. Each of these criteria measures a different
aspect of financial performance and/or position.
Liquidity
indicates the ability of the business to meet financial obligations when they
come due. Timely payment of the obligations of the business, including
principal and interest on debt without disrupting the normal operation, is an
indication the business is liquid.
Solvency
measures the ability of the firm to pay all debts if the assets of the business
are sold. Generally, if the market value of total assets exceeds existing debt
obligations against those assets, the business is solvent.
Profitability
is an indication of the level of income produced by the farm business and is
measured in terms of rates of return produced by the labor, management, and
capital of the business.
Financial
efficiency measures the degree of efficiency with which labor, management, and
capital are used in the business. Efficiency indicates the relationship between
inputs and outputs and can be measured in physical or financial terms.
Repayment
capacity measures the ability of the business to repay existing debt
commitments from farm and nonfarm income, and it is closely related to the
concept of liquidity.
Each of these criteria plays an important role in the analysis of financial performance and position of a business, and each has alternative measures that are discussed in this OSU Fact Sheet.

How
Does a Financial Controller Work?
A
financial controller takes care of an organization’s basic and advanced
financial activities. The person in charge plays a vital role in ensuring the
records’ accuracy is maintained. Controllers in a corporate firm are hired to
enhance the reliability of a business.
As
a business grows, the cash inflows and outflows are more frequent. Hence,
depending on bookkeepers for accurate records might be risky. Hiring a
controller to track the frequent transactions and check the records for
correctness becomes mandatory. These individuals ensure a company’s financial
documents are up to the mark and reliable for auditors to validate and
stakeholders to go through before making major decisions.
When
a company records a revenue of over $5 million, it is expected to
have a financial controller to control and supervise all basic and advanced
financial activities. The controllers are well aware of the generally
accepted accounting principles (GAAP) standards. Hence, they make sure
the financial statements generated by the companies meet the
requirements of investors and other stakeholders.
The
controllers participate in all kinds of business activities involving
financial expenditure. Besides the financial responsibilities handled, they
also take care of the insurance, information technology, sales tax
reporting, federal income tax reporting, human resources, and other
functions. In addition, these professionals also ensure managing the internal
controls so that the financial affairs are properly recorded and presented
for further decision making of the internal and external stakeholders of the
organizations.
Responsibilities
From
the roles that the controller plays, their duties are quite clear. However, a
set of financial controller responsibilities make their presence
mandatory for any organization. Let us have a look at some of them:

Example
Let
us consider the following example to understand the concept well:
A
small-scale company appoints Robert as the financial controller, acting as the
chief accounts officer. He has ten years of experience in accounting and
finance, and he is a Certified Public Accountant (CPA).
As
a controller, he is expected to manage all the finance and accounting
functions, including generating income statements, cash flow
statements, framing accounting policies, deciding the budget, etc. The
company assigns him tasks to distribute among an allotted team of 10 executives.
Robert joins the office and undertakes all tasks. He begins monitoring the
company’s financial statements as prepared and other duties allocated to him.
Investors
then use these financial statements to decide whether to invest in the
company’s assets, and auditors utilize them to check and validate the cash
inflows and outflows of the organization. In addition, he ensures getting
timely information from those departments so that his department’s work runs
smoothly.
Non-financial
performance measure that aligns with churn and retention rates. Businesses
typically measure customer experience by looking at all the business areas
where a customer directly interacts with the company, such as a customer
support team.
Significance of
non-financial performance measures
Financial
measures tend to focus on indicators that look into past performance, making
them relatively easy to analyze. Despite this, they often lack context, such as
why performance fell over a certain period. Non-financial performance measures
help add context to this analysis. For example, if the marketing resources fall
short in one quarter, the next quarter might experience a drop in sales. The
other main reason why non-financial measures are crucial for businesses is that
you can align them with certain parts of a business's strategy. It's unlikely
for an organization to include a mission or vision statement that focuses on
financial measures. Instead, they tend to align with things like best branding
and this might be challenging to equate to fiscal indicators. Non-financial
measurements, such as brand awareness figures, are much more useful in this
regard.
Benefits
of tracking non-financial performance measures
Although
financial measures are usually vital for a company to be aware of to understand
their performance, non-financial measures provide several benefits that help
companies measure their performance with additional context and fidelity. Some
of the main benefits associated with tracking non-financial performance
measures include:
Determines
strengths and weaknesses: By looking at these metrics, companies can gain
a greater awareness of their strengths and weaknesses. For example, certain
aspects of customer service, such as long hold times, are easier to identify by
using non-financial performance measures.
Tracks
business performance: One of the main benefits of using non-financial
performance measures is that they help track business performance. For
instance, if the HR team overspends, these metrics track this issue and may highlight
high staff turnover rates as the cause.
Improves
staff feedback: These measures are also a great way of guiding staff to
achieve success and align with the business's overall strategy. By using these
metrics, staff gain the opportunity to receive feedback that tells them what
targets to meet to succeed in their roles.
Adjusts
for external factors: Non-financial performance measures also consider
external risks, such as market volatility or unforeseen global events. Due to
this, using these metrics allow companies to gain a clear overview of their
performance, with any external factors included in this outlook.
15
Examples of Non-Financial Performance Measures
Taking
the Balanced Scorecard approach, there are four perspectives involved in
strategy management: customer, internal processes (operations), learning and
growth (HR), and financial. Below are 15 examples of performance KPIs,
organized by the three non-financial perspectives:
Customers
- Conversion Rate: The percentage of
interactions that result in a sale. Formula: (Interactions with Completed
Transactions) / (Total Sales Interactions) = (Conversion Rate)
- Retention Rate: The portion of consumers
who remain customers for an entire reporting period. Formula: (Customers
Lost in a Given Period) / (Number of Customers at the Start of a Period) =
(Customer Retention Rate)
- Contact Volume By Channel: The number of
support requests by phone and email. This allows the organization to not
only compare which method customers prefer, but also to track the number
of support requests month-to-month.
- Customer Satisfaction Index: Gauge of a
company’s success at meeting customers’ needs.
- Net Promoter Score: The likelihood that
customers will recommend a brand to others. A score from 1-10 that
qualifies promoters (usually 9-10) and detractors (under 6).
- Formula: (Number of Promoters) - (Number of
Detractors) = (Net Promoter Score)
- Customer Support Tickets: The number of
new tickets, the number of resolved tickets, and resolution time.
- Product Defect Percentage: This will give
you the percentage of defective products in a specified timeframe.
Formula: (Number of Defective Units in a Given Period) / (Total Number of
Units Produced in a Given Period) = (Product Defect Percentage)
- On-Time Rate: The percentage of time products
were delivered promptly as scheduled. Formula: (Number of On-Time Units in
a Given Period) / (Total Number of Units Shipped in a Given Period) =
(On-Time Rate)
- Efficiency Measure: Efficiency can be
measured differently in every industry, so this common KPI will vary. For
example, the manufacturing industry can measure efficiency by analyzing
how many units are produced every hour and the plant’s uptime percentage.
- Overdue Project Percentage: The number of
projects that are late or behind schedule. This can be pulled from
your project status dashboard. Formula: (Number of Overdue
Projects in a Given Period) / (Total Number of Projects in a Given Period)
= (Overdue Project Percentage)
Learning
& Growth
- Salary Competitiveness Ratio (SCR): The
competitiveness of compensation options. Formula: (Average Company Salary)
/ (Average Salary Offered from Competitors (or Average Salary Offered by
Industry)) = (SCR).
- Employee Productivity Rate: Workforce
efficiency measured over time. Formula: (Total Company Revenue) / (Total
Number of Employees) = (Employee Productivity Rate).
- Turnover Rate For Highest Performers: The
success of retention efforts for top performers and plans for talent
replacement. Formula: (Number of High Performers Who Departed in Past
Year) / (Total High Performers Identified) = (High Performer Turnover
Rate).
- Average Time To Hire: The efficiency of
the hiring process measured by time to recruit, interview, and hire.
- Internal Promotion Rate: The successful
retention and growth of top performers. (The Number of Promoted
Individuals) / (Total Number of Employees) = (Internal Promotion Rate).
Remember
to track the non-performance measures that best fit your organization’s needs.
There are hundreds of KPIs to choose from—focus on the ones that make the most
sense for your strategy.
Nonfinancial
Performance Measures: The Balanced Scorecard
Question:
Although financial measures are important for evaluation purposes, many
organizations use a mix of financial and nonfinancial measures to evaluate
performance. For example, airlines track on-time arrival percentages carefully,
and delivery companies like Federal Express (FedEx) and United
Parcel Service (UPS) monitor percentages of on-time deliveries. The
balanced scorecard uses several alternative measures to evaluate
performance. What is a balanced scorecard and how does it help companies
to evaluate performance?
Answer:
The balanced scorecard is a balanced set of measures that
organizations use to motivate employees and evaluate performance. These
measures are typically separated into four perspectives outlined in the
following. (Dr. Robert S. Kaplan and Dr. David P. Norton created the balanced
scorecard, and it is actively promoted through their company, Balanced
Scorecard Collaborative.
- Financial. Measures that shareholders,
creditors, and other stakeholders use to evaluate financial performance.
- Internal business process. Measures that
management uses to evaluate efficiency of existing business processes.
- Learning and growth. Measures that
management uses to evaluate effectiveness of employee training.
- Customer. Measures that management uses
to evaluate whether the organization is meeting customer expectations.
The
goal is to link these four perspectives to the company’s strategies and goals.
For example, a high percentage of on-time arrivals is likely an important goal
from the perspective of the customer of an airline. A high percentage
of defect-free computer chips is likely an important goal from
the internal business process perspective of a computer chip maker. A
high number of continuing education hours is likely an important goal from
the learning and growth perspective for tax personnel at an
accounting firm. Measures from a financial perspective were covered
earlier in this chapter.
Companies
that use the balanced scorecard typically establish several measures for each
perspective. "Balanced Scorecard Measures" lists several
examples of these measures.
Table
13.4 Balanced Scorecard Measures
|
Financial |
Internal
Business Process |
Learning
and Growth |
Customer |
|
Gross
margin ratio |
Defect-free
rate |
Hours
of employee training |
Customer
satisfaction (survey) |
|
Return
on assets |
Customer
response time |
Employee
satisfaction (survey) |
Number
of customer complaints |
|
Receivables
turnover |
Capacity
utilization |
Employee
turnover |
Market
share |
|
Inventory
turnover |
New
product development time |
Number
of employee accidents |
Number
of returned products |
Measures
established across the four perspectives of the balanced scorecard are linked
in a way that motivates employees to achieve company goals. For example, if the
company wants to increase the defect-free rate and reduce product returns,
effective employee training and low employee turnover will help in achieving
this goal. The idea is to establish company goals first, then create measures
that motivate employees to reach company goals.
KEY
TAKEAWAY
Most
organizations use a mix of financial and nonfinancial measures to evaluate
performance. The balanced scorecard approach uses a balanced set of measures
separated into four perspectives—financial, internal business process, learning
and growth, and customer. The last three perspectives tend to include
nonfinancial measures, such as hours of employee training or number of customer
complaints, to evaluate performance. The goal is to link financial and
nonfinancial measures to the company’s strategies and goals.
REVIEW
PROBLEM
Assume
Chicken Deluxe, the fast-food restaurant franchise featured in this chapter,
uses a balanced scorecard. Provide at least two examples of measures that
Chicken Deluxe might use for each of the following perspectives of the balanced
scorecard:
Financial
Internal
business process
Learning
and growth
Customer
Solution
to Review Problem
Answers
will vary. Several examples of financial measures are as follows:
Gross
margin ratio
Profit
margin ratio
Return
on assets
Receivables
turnover
Inventory
turnover
Answers
will vary. Several examples of internal business process measures are as
follows:
Capacity
utilization
Amount
of food spoilage
Order
response time
Answers
will vary. Several examples of learning and growth measures are as follows:
Hours
of employee training
Employee
satisfaction
Employee
turnover
Number
of employee accidents
Answers
will vary. Several examples of customer perspective measures are as follows:
Customer
satisfaction
Number
of customer complaints
Market
share
Amount
of food returned
Questions
1.
Relevant Questions for Strategic Control
- Is the premises created at the time of
formulation of strategy proving to be correct?
- Is the implementation of strategy is done
properly?
- Is there any requirement for change in the
strategy? If the answer is yes, what sort of change is needed which
guarantees strategic effectiveness?
- Relevant Questions for Operational Control
- How is the performance of the organization?
- Are the resources of the organizations being
utilized in an optimum manner?
- What actions are required to be taken which
confirm appropriate utilization of the resources so as to meet the
objectives of the organization?
2. How to evaluate the financial performance of
a company?
- The
following indicators are used to evaluate a firm’s performance:
1. Quick Ratio
2. Current Ratio
3. Working Capital
4. Gross Profit Margin
5. Net Profit Margin
6. Equity Multiplier
7. Debt-to-Equity Ratio
8. Return on Equity
9. Return on Asset
10. Total Asset Turnover
11. Inventory Turnover
12. Operating Cash Flow
How to improve
the financial performance of a company?
A firm’s financial performance can be improved by
implementing the following steps:
1. Sell off obsolete or unnecessary assets.
2. Improve cash inflows by speeding debt recovery.
3. Gradually reduce debts—to enhance debt-to-equity ratios.
4. Enhance profitability by eliminating unnecessary expenses.
5. Ensure proper inventory management—to reduce wastage.
6. Maintain sufficient working capital—for timely fulfillment of obligations.
Why
is financial performance important for organizations?
Investors
and shareholders go through the statement that depicts the firm’s financial
performance. They ascertain a firm’s financial health and profitability before
investing. In addition, business owners and managers use this analysis to
improve the financial condition of a firm.
Questions
1.
What
is trend analysis? Explain how the percent change from one period to the next
is calculated.
2.
What
is common-size analysis? How is common-size analysis information used?
3.
Explain
the difference between trend analysis and common-size analysis.
4.
Name
the ratios used to evaluate profitability. Explain what the statement “evaluate
profitability” means.
5.
Coca-Cola’s return
on assets was 19.4 percent, and return on common shareholders’ equity was 41.7
percent. Briefly explain why these two percentages are different.
6.
Coca-Cola had
earnings per share of $5.12, and PepsiCo had earnings per share of
$3.97. Is it accurate to conclude PepsiCo was more profitable?
Explain your reasoning.
7.
Name
the ratios used to evaluate short-term liquidity. Explain what the statement
“evaluate short-term liquidity” means.
8.
Explain
the difference between the current ratio and the quick ratio.
9.
Coca-Cola had
an inventory turnover ratio of 5.07 times (every 71.99 days),
and PepsiCo had an inventory turnover ratio of 8.87 times (every
41.15 days). Which company had the best inventory turnover? Explain your reasoning.
10. Name the ratios
used to evaluate long-term solvency. Explain what the term “long-term solvency”
means.
11. Name the
measures used to determine and evaluate the market value of a company. Briefly
describe the meaning of each measure.
12. What is the
balanced scorecard? Briefly describe the four perspectives of the balanced
scorecard.
What
is Transfer Pricing?
Transfer pricing refers to the prices of goods and services that are
exchanged between companies under common control. For example, if a subsidiary
company sells goods or renders services to its holding company or a sister
company, the price charged is referred to as the transfer price
Example
Consider
ABC Co., a U.S.-based pen company manufacturing pens at a cost of 10 cents each
in the U.S. ABC Co.’s subsidiary in Canada, XYZ Co., sells the pens to Canadian
customers at $1 per pen and spends 10 cents per pen on marketing and
distribution. The group’s total profit amounts to 80 cents per pen.
Now,
ABC Co. will charge a transfer price of between 20 cents and 80 cents per pen
to its subsidiary. In the absence of transfer price regulations, ABC Co. will
identify where tax rates are lowest and seek to put more profit in that
country. Thus, if U.S. tax rates are higher than Canadian tax rates, the
company is likely to assign the lowest possible transfer price to the sale of
pens to XYZ Co.
Arm’s
Length Principle
Article
9 of the OECD Model Tax Convention describes the rules for the Arm’s Length
Principle. It states that transfer prices between two commonly controlled
entities must be treated as if they are two independent entities, and therefore
negotiate at arm’s length.
The
Arm’s Length Principle is based on real markets and provides a single
international standard of tax computation, which enables various governments to
collect their share of taxes and at the same time creates enough provisions for
MNCs to avoid double taxation.
Case
Study: How Google Uses Transfer Pricing
Google
runs a regional headquarters in Singapore and a subsidiary in Australia. The Australian
subsidiary provides sales and marketing support services to users and
Australian companies. The Australian subsidiary also provides research services
to Google worldwide. In FY 2012-13, Google Australia earned around $46 million
as profit on revenues of $358 million. The corporate tax payment was estimated
at AU$7.1 million, after claiming a tax credit of $4.5 million.
When
asked about why Google did not pay more taxes in Australia, Ms. Maile Carnegie,
the former chief of Google Australia, replied that Singapore’s share in taxes
was already paid in the country where they were headquartered. Google reported
total tax payments of US $3.3 billion against revenues of $66 billion. The
effective tax rates come to 19%, which is less than the statutory corporate tax
rate of 35% in the US.
Benefits
of Transfer Pricing
Transfer
pricing helps in reducing duty costs by shipping goods into countries with high
tariff rates by using low transfer prices so that the duty base of such
transactions is lowered.
Reducing
income and corporate taxes in high tax countries by overpricing goods that are
transferred to countries with lower tax rates helps companies obtain higher
profit margins.
Risks
There
can be disagreements within the divisions of an organization regarding the
policies on pricing and transfer.
Lots
of additional costs are incurred in terms of time and manpower required in
executing transfer prices and maintaining a proper accounting system to support
them. Transfer pricing is a very complicated and time-consuming methodology.
It
gets difficult to establish prices for intangible items such as services
rendered, which are not sold externally.
Sellers
and buyers perform different functions and, thus, assume different types of
risks. For instance, the seller may refuse to provide a warranty for the
product. But the price paid by the buyer would be affected by the difference.
The
objective of a transfer pricing policy
The
objective of transfer pricing policies is two-fold:
1.
Harmony. Ensure that everyone in the firm is “on the same page” when it comes
to the transfer pricing arrangements. Successful implementation of transfer
pricing only works if there is “buy-in” from stakeholders. Before becoming
reality, it needs to be understood.
Example I: The finance
department wants to know what amounts to charge to which group entity (and
when), the risk department wants to ensure that transfer pricing arrangements
do not create risks, and the manager wants to know whether his/her financial
results are affected.
2.
Compliance. Demonstrate towards tax authorities that transfer pricing has been
considered and implemented the right way. It shows a proactive attitude which
is highly appreciated by tax authorities. It sets you apart from the crowd.
Example II: During a tax
audit, tax authorities normally check whether compliance / documentation
requirements are met. Besides showing the customary 100-page transfer pricing
report, it is powerful if a MNE can show exactly how the transfer pricing
arrangements have been implemented and are being complied with.
Example III: Added Value of
a Transfer Pricing Policy
If
you’re not convinced that a transfer pricing policy adds significant value to
your transfer pricing strategy, please read the following example (based on a
real case):
Teddy
Transportation (a global distribution firm) has invested significant time and
money in the preparation of a transfer pricing analysis and rock-solid
documentation. Further, the required intercompany agreements are in place. In
practice, not much follow-up has been done. Moreover, there is no (formal)
transfer pricing policy. Teddy Transportation operates this way for a couple of
years.
One
day the tax authorities knock on the door. They inquire about the transfer
pricing of Teddy Transportation. Teddy Transportation proudly shows them the
rock-solid documentation and intercompany agreements. Next, the tax authorities
check the books of various associated enterprises. They discover the following:
The
finance department has issued invoices for Intercompany support services for
amounts higher than they should be according to the transfer pricing
documentation and intercompany agreements.
There
are discrepancies between what is described in the transfer pricing
documentation and the actual behavior of associated enterprises. For example,
the documentation states that there are one Principal entity and several
Low-Risk Distributor (LRD) entities. Under this model, the LRD entities do not
assume much risk and do not get involved in marketing, price-setting, etc. In
practice, however, the “LRD entities” are assuming (much) more risks and
functions. They may very well be considered “Full-Fledged Distributors!”
Two
group entities have concluded an intercompany loan that the tax department did
not know of. Thus, it wasn’t included in any transfer pricing documentation.
Based
on these findings, the tax authorities are not convinced that Teddy
Transportation complies with transfer pricing rules. It starts an investigation
to verify:
whether
the allocation of risks, assets and functions on which the transfer pricing has
been based is in line with reality (actual behavior)
whether
there is transfer pricing documentation for all intercompany transactions.
The
above could have been avoided if Teddy Transportation had clearly laid down the
transfer pricing policies. Everyone should have had clarity on matters such as
what amount to invoice, how to invoice, how to book the transactions, how to
stay within the functionality borders of the Principal/LRD model, and who to
inform when a new intercompany loan arrangement is put in place.
Unfortunately,
Teddy Transportation now must spend time and money to address this. Resulting
potentially in more taxes and penalties if the tax authorities decide to make
adjustments to the transfer pricing…
How
to prepare a Transfer Pricing Policy?
It
goes beyond the scope of this article to discuss in detail what needs to be
included in a transfer pricing policy, however, in general, we advise to
include the following elements:
Transfer Price =
Outlay Cost + Opportunity Cost
For example, consider a division that makes hats. The cost of making one hat is
$2. That division can sell the hat in the marketplace for the market price of
$5. Therefore, the opportunity cost of selling the hat internally
instead of externally is $3. The transfer price would then be $5.
$5 = $2 + $3
In this simple example the transfer price is the same as the market price.
In more complex examples this might not be the case. However, transfer prices are
frequently based on or similar to market prices.
How
does transfer pricing work?
Transfer
pricing is a way of setting prices for transactions within a company or a group
of companies under the same management or ownership. This applies to both
international and domestic transactions. A transfer price is the amount that
one division or subsidiary charges from another for a product or service they
provide. Transfer prices are usually based on the market price for the product
or service. Transfer pricing can also be used for research, patents, or
royalties. Multinational companies can legally use transfer pricing to allocate
their profits among their parent and subsidiary entities.
However,
some companies may also use (or abuse) this method to manipulate their
corporate income and lower their overall taxes. Transfer pricing helps
companies to shift tax liabilities to low-tax jurisdictions.
Example
of Transfer Pricing: ABC and CBD are both subsidiaries of XYZ's company.
ABC manufactures cars and imports the engine from CBD. The price that ABC pays
to CBD for the engine is the transfer price. Transfer pricing can affect the
profitability and tax liability of each subsidiary and the parent company. If
CBD charges a lower price, then the revenue of CBD will be lower; on the other
hand, the cost of the car for ABC is lower, increasing the company’s profit. In
short, Company CBD’s revenues are lower by the same amount as Company ABC’s
cost savings—so there's no financial impact on the parent company.
Suppose
company CBD operates in a higher tax rate country; XYZ can save taxes by making
CBD less profitable and ABC more profitable. In other words, company CBD’s
decision not to charge market pricing to company ABC allows the parent company
to save taxes.
What
are the methods of transfer pricing?
Section
92C(1) prescribed the methods of arm’s length, which are the followings:
CUP
(Comparable Uncontrolled Price Method): This method compares the price
charged in a controlled transaction (between related parties) with the price
charged in a comparable uncontrolled transaction (between independent parties)
under similar circumstances. It is price for identical or nearly identical
property traded between the two independent parties under the same or similar
circumstance. This method is favored when there is a high degree of
comparability between the transactions and the markets.
Resale
Price Method: This method compares the gross margin obtained by a reseller
in a controlled transaction (between related parties) with the gross margin
earned by a comparable reseller in an uncontrolled transaction (between
independent parties) under similar circumstances. This method is suitable when
the reseller/distributor does not add much value to the product and acts as an
intermediary.
In
this method the price at which the product or services are resold or provided
to an unrelated party is identified. After adjusting gross profit margin and
other expenses from resale value, the resulting amount is considered as arm
length price.
Cost
Plus Method: This method compares the mark-up on costs obtained by a
supplier in a controlled transaction (between related parties) with the mark-up
on costs earned by a comparable supplier in an uncontrolled transaction
(between independent parties) under similar circumstances. This method is
appropriate when the supplier provides goods or services that are not highly
customized or complex and does not assume significant risks.
Profit
Split Method: This method allocates the combined profit or loss from a
controlled transaction (between related parties) among the participants based
on their relative contributions to the value creation. This method is
applicable when the participants are highly integrated and interdependent and
share significant risks and intangible assets.
(TNMM)
Transactional Net Margin Method: This method compares the net profit
margin earned by a tested party in a controlled transaction (between related
parties) with the net profit margin earned by a comparable party in an
uncontrolled transaction (between independent parties) under similar
circumstances. This method is useful when comparability is needed at the
transaction level or when multiple transactions must be aggregated
What
do you mean by capital expenditure control?
Periodical
totals of the capital expenditures incurred are made in the Capital Expenditure
Project Sheet to have a continuous control over expenditure. The progress of
the expenditure incurred on a project is reported from time to time to the
management through Capital Expenditure Progress Statement.
Objectives
of Control of Capital Expenditure:
The
following are the main objectives of control of capital expenditure:
(1)
To make an estimate of capital expenditure and to see that the total cash
outlay is within the financial resources of the enterprise.
(2)
To ensure timely cash inflows for the projects so that non-availability of cash
may not be a problem in the implementation of the project.
(3)
To ensure that all capital expenditure is properly sanctioned.
(4)
To properly co-ordinate the projects of various departments.
(5)
To fix priorities among various projects and ensure their follow up.
(6)
To compare periodically actual expenditures with the budgeted or.es so as to
avoid any excess expenditure.
(7)
To measure the performance of the project.
(8)
To ensure that sufficient amount of capital expenditure is incurred to keep
pace with the rapid technological developments.
(9)
To prevent over-expansion.
Steps
Involved in the Control of Capital Expenditure:
The
various steps involved in the control of capital expenditure are:
(a)
Preparation of capital expenditure budget.
(b)
Proper authorization of capital expenditure.
(c)
Recording and control of expenditure.
(d)
Evaluation of performance of the project.
(a)
Preparation of Capital Expenditure Budget:
The
first step in the control of capital expenditure is to prepare a capital
expenditure budget. The budget lays down the amount of estimated expenditure to
be incurred on fixed assets during the budget period. As the amount involved in
capital expenditure is usually high this requires careful attention of the top
management.
The
budget is based upon the annual forecasts of capital expenditure of various
divisions or departments. Each division or department of an organisation sends
the annual forecast of capital expenditure of its own department to Capital
Expenditure Sanction Committee. The Committee after considering the
profitability of the capital expenditure sanctions the expenditure and then the
amount is incorporated in the budget.
(b)
Proper Authorization of Capital Expenditure:
Preparation
of a capital expenditure budget and incorporation of a particular project in
the budget does not itself authorize to go ahead with the implementation of the
project. A request for authority to spend the amount should further be made to
the Capital Expenditure Committee which may like to review the profitability of
the project in the changed circumstances to see:
(a)
Whether the project is as good as when budgeted?
(b)
Whether funds are available as budgeted? and
(c)
Whether any better alternative uses of funds have arisen since the approval of
the budget?
After
making a fresh review, the Committee approves the expenditure. Projects
involving only small amounts of expenditure may be approved by a senior manager
without referring to the Committee.
(c)
Recording and Control of Expenditure:
Once
a capital expenditure is duly sanctioned, a proper record of the capital
expenditure has to be made. The record of the capital expenditure is made on
the basis of the information contained in the Capital Expenditure Request and
Sanction Form. A Capital Project Sheet serially numbered is used for this
purpose and all the details of the sanctioned project are written up in the
Project Sheet.
Each
capital expenditure project is assigned a number to distinguish it from other
projects. All expenditure incurred is recorded in the project sheet at regular
intervals. (A specimen of the Capital Expenditure Project Sheet is given). The
various external costs are recorded from material requisition notes, time
sheets or labour cards and overhead recovery statements.
Periodical
totals of the capital expenditures incurred are made in the Capital Expenditure
Project Sheet to have a continuous control over expenditure. The progress of
the expenditure incurred on a project is reported from time to time to the
management through Capital Expenditure Progress Statement.
In
case any project is likely to exceed the authorized expenditure, then
supplementary sanction should be obtained. It must be seen that no expenditure
is incurred over and above the sanctioned amount. Capital Expenditure Progress
Statements help in taking timely decisions before it is too late to correct
them.
(d)
Evaluation of the Performance of the Project:
The
last stage in the control of the capital expenditure is the evaluation of the
performance of the project. This evaluation is made through post completion
audit which provides comparison of the actual expenditure incurred on the
project with the budgeted or estimated expenditure.
The
post completion audit should be carried by a team of experts who are
independent of those who originated the projects. Such an evaluation of the
performance of the project helps in developing the capital expenditure policy
and planning for future.
Lastly
an overall check is made by calculating the return from investment to see
whether the project yields the anticipated return or not. In case a project
fails to give the anticipated return on investment the causes for the variance
should be found out so that corrective action may be taken for the future.
Tools
& Techniques of Capital Expenditure Control
What
are the Tools & Techniques of Capital Expenditure Control ?
The
4 tools & techniques of capital expenditure control are describes as
follows :
Ø
Performance
Index
Ø
Technical
Performance Measurement (TPM)
Ø
Post
Completion Audit
Ø
Earned
Value Method
Performance
Index
Often
it is necessary to present information from several related areas
simultaneously. This is done to provide a statistical measure of how
performance changes over time. The performance index is a management tool that
allows multiple sets of information to be compiled into an overall
measure. The two Performance Indexes in the project cost management. These
indexes are :
- Schedule Performance Index (SPI)
The
Schedule Performance Index is the ratio of total original authorized duration
versus total final project duration. The ability to accurately forecast
schedule helps meet time-to-market windows. SPI Standard Deviation is an even
better metric that shows the accuracy of schedule estimating. The Schedule
Performance Index tells us about the efficiency of time utilized on the
project. It is a measure of progress achieved compared to the planned progress.
Schedule
Performance Index = (Earned Value)/(Planned Value)
SPI
= EV/PV
The
Schedule Performance Index informs us how efficiently we are actually
progressing compared to the planned progress.
Note:
If
Schedule Performance Index (SPI) is greater than one, this means more work
has been completed than the planned work.
If
SPI is less than one, this means less work is completed than the planned
work.
If
SPI is equal to one, this means the work completed is equal to the planned
work.
- Cost Performance Index (CPI)
The
Cost Performance Index is a measure of cost efficiency. It's determined by
dividing the value of the work actually performed (the earned value) by the
actual costs that it took to accomplish the earned value. The ability to
accurately forecast cost performance allows organizations to confidently allocate
capital, reducing financial risk, possibly reducing the cost of capital. CPI
Standard Deviation is an even better metric, one that shows the accuracy of
budget estimating. The Cost Performance Index tells us about the
efficiency of the cost utilized on the project. It is the measure of the value
of the work completed compared to the actual cost spent on the project.
Cost
Performance Index = (Earned Value)/(Actual Cost)
CPI
= EV/AC
The
Cost Performance Index informs us how much we are earning for each dollar spent
on the project.
Note
:
If
Cost Performance Index (CPI) is less than one, this means we are earning
less than the spending.
If
CPI is greater than one, this means we are earning more than the
spending.
If
CPI is equal to one, this means earning and spending is equal.
Performance Evaluation Parameters for Banks:
Sound
financial health of a bank is the guarantee not only to its depositors but is
equally significant for the shareholders, employees and whole economy as well.
As a sequel to this maxim, efforts have been made from time to time, to measure
the financial position of each bank and manage it efficiently and effectively.
With the integration of Indian financial sector with the rest of the world, the
concept of banks and banking has undergone a paradigm shift.
A) Customer Base: Client relationship, getting
back to basics, customer centric culture etc., are some of the buzzwords in the
present-day banking universe. Banks today is going out of their way to get
closer to the customer and align their product & service offerings to best
match the customer needs.
a) Meaning: A customer base is a group of
customers who could be served by a business. Many people define this term as
only the consumers who already patronize a business, but others include any
consumer with certain purchasing characteristics in this category, even if that
customer has yet to be convinced to enter the store or take advantage of a
product. Within the larger group is a smaller subset of the customer base that
is made up of loyal shoppers, also called repeat customers.
Examples
of Banking Performance Reviews
Example
1
John
Doe is a senior banker with four years of experience in his current role. He
consistently provides excellent customer service and profoundly understands the
organization’s products and services. He is proactive in finding solutions for
customers and often takes the initiative to solve complex problems.
In
addition, John has been instrumental in developing process improvements that
have improved efficiency across the department. Overall, it has been a pleasure
working with John; he is an asset to our team.
Example
2
Jane
Smith is a junior banker who has been with the organization for one year. She
shows great potential but still needs improvement in some areas. She
demonstrates good communication skills but could benefit from additional
financial regulations and processes training.
Jane
is also very organized and has the potential to take on larger projects with
more responsibility. With some extra guidance and support, she should be able
to reach her full potential.
Example
3
Carl
Johnson is a mid-level banker with five years of experience in his current
role. He has been a great asset to the team. He is always willing to help out
when needed and brings great ideas to the table.
Carl’s
financial knowledge is excellent, but he could use additional training in
customer service skills. He also needs to improve his time management skills
and focus on completing tasks within deadlines. With further development, Carl
can become an even more significant asset to our organization.
Top
10 Banking Performance Comments
1.
“You have excellent customer service skills and always take initiative to help
customers find the best solutions for their needs.”
2.
“Your financial knowledge is impressive, and you understand all of the
organization’s products and services.”
3.
“You are able to collaborate with colleagues and contribute valuable ideas to
our team discussions.”
4.
“You show great organizational skills when managing projects or tasks.”
5.
“You have a keen understanding of banking regulations and remain compliant at
all times.”
6.
“Your time management skills have improved over the past year, and you
consistently meet deadlines on time.”
7.
“You have a natural ability to think on your feet and quickly adapt in
challenging situations.”
8.
“You continually demonstrate that you are willing to take on larger projects
with more responsibility.”
9.
“Your attitude is always positive, and you remain professional in all
interactions with customers or clients.”
10.
“You are eager to learn new methods, technologies, or processes which will help
strengthen our organization over time.”
Conclusion
Performance
reviews are an essential part of any banking job, allowing employees to
showcase their achievements and identify areas for improvement. You can
understand common banking performance review examples.
Following
our tips on making the most of this experience, you can ensure that you get the
best out of every performance review. With proper preparation and a positive
attitude, banking performance reviews can become valuable in helping you reach
your goals.
Retail
KPIs, goals, and measures of success
The
first step in creating retail KPIs is to define your business objectives, which
can include the growth of your teams, locations, online revenue, and more. The
next step is to create strategies to reach those objectives, and track the
results of those strategies (metrics). KPIs should always ladder up to
strategies that meet a business objective. Your business may use all or just a
combination of the following metrics:
Ø
Sales
per square foot
Ø
Gross
margins return on investment
Ø
Average
transaction value
Ø
Customer
retention
Ø
Conversion
rate
Ø
Foot
traffic and digital traffic
Ø
Inventory
turnover
The
most common indicator of growth in retail is the sales volume. If you’re
selling more, then you’re growing. However, growth encompasses more than just
the number of sales, it also involves improving your processes. Improved
processes can mean becoming efficient in reaching more customers, improving
employee morale, and cost-effectively expanding or shrinking your inventory. In
the end, those will translate to more sales and better business growth. Below
are some of the most common retail KPIs to measure success.
Sales
per square foot
Formula: Total
net sales / Total square foot Sales per square foot is a compelling metric if
you have a physical retail space. Sales per square foot measures how
effectively you’re using the area you have, and sales per square inch is a good
indicator of your store’s productivity while offering insights into store and
merchandise layouts. You can visualize these insights with heat maps of your
locations and dig into the data to determine why some merchandise performs
better than others. If one section is performing better than another, it may be
due to the types of products or their arrangement. When you see how the store
layout is performing, then you can improve it and improve sales results. In
practice, research in this area has found that products at eye level are more
popular than products higher or lower on shelves. And retailers often place
smaller consumable items by the register to encourage last-minute purchases.
Retailers uncover these insights by sales by digging in and getting curious
about square foot metrics.
Gross
margins return on investment (GMROI)
Formula: Total
gross profit / Average inventory cost While this one sounds similar in name to
the baseline gross profits metric, its purpose is a bit different. GMROI
measures the profit you make from the amount you invest in product stock. What
this means in practice is that for every dollar you spend in your inventory,
this KPI can tell you how many dollars you get back. Return on investment is
vital to track for a couple of reasons. It offers more nuance than just sales
or profit margins. GMROI generally tracks specific products or categories
rather than inventory as a whole. Its specificity can tell you what is worth
carrying in your stock and what is not, as well as what you could invest
further in. The more you make on each profit margin, the better your retail
business does as a whole. Growth comes when you find products worth investing
in and have a good return on their initial costs.
What
Is ABC Analysis in Inventory Management?
ABC
analysis is an inventory management technique that determines the value of
inventory items based on their importance to the business. ABC ranks items on
demand, cost and risk data, and inventory mangers group items into classes based
on those criteria. This helps business leaders understand which products or
services are most critical to the financial success of their organization.
The
most important stock keeping units (SKUs), based on either sales volume or
profitability, are “Class A” items, the next-most important are Class B and the
least important are Class C. Some companies may choose a classification system
that breaks products into more than just those three groups (A-F, for example).
ABC
analysis in cost accounting, or activity-based costing, is loosely related but
different from ABC analysis for inventory management. Accountants use
activity-based costing in manufacturing to assign indirect or overhead costs
like utilities or salaries to products and services.
How Is ABC Inventory Analysis
Calculated?
Conduct
ABC inventory analysis by multiplying the annual sales of a certain item by its
cost. The results tell you which goods are high priority and which yield a low
profit, so you know where to focus human and capital resources.
Use
this formula for ABC inventory analysis:
(Annual
number of items sold) x (Cost per item) = (Annual usage value
per product)
You
can use Microsoft Excel to do a basic ABC inventory analysis. List each product
or resource in descending order according to its product usage value. Calculate
the total of each item in the aggregate amount. Determine the values for the A,
B and C categories, then assign a group name to each item. The goods with the
highest value then get the manager's closest attention.
Example
of an ABC Analysis Calculation
Below
is an example of an ABC analysis of inventory for a small retail business that
shows the Pareto Principle at work, with many lower volume products also among
the highest-value ones. The resulting Pareto Diagram shows the characteristic
curve that illustrates the 80/20 rule, where items rank and roughly where to
drop them into A, B or C classifications.
For
more information about benefits and best practices, check out our
inventory management guide.
How
ABC Analysis Simplifies Work for Inventory Managers
Inventory
managers are always looking for ways to improve pricing and quality or to
achieve greater efficiencies. In light of that goal, they may use the ABC
technique, sometimes called the “always better control” method. They can use
the analysis to focus their time and effort primarily on Class A inventory and
less on B and C class products. For example, inventory managers will use ABC
analysis to check the purchase orders of the highest value (Class A items) products
first, since these generate the most revenue.
Why
Use ABC Analysis?
Using
ABC analysis for inventory helps better control working capital costs. The
information gained from the analysis reduces obsolete inventory and can boost
the inventory turnover rate, or how often a business has to replace items after
selling through them.
ABC
Analysis Benefits
A
long list of benefits can result from applying ABC analysis to inventory
management, including:
- Increased Inventory Optimization: The
analysis identifies the products that are in demand. A company can then
use its precious warehouse space to adequately stock those goods and
maintain lower stock levels for Class B or C items.
- Improved Inventory Forecasting: Monitoring
and collecting data about products that have high customer demand can
increase the accuracy of sales forecasting. Managers can use this
information to set inventory levels and prices to increase overall revenue
for the company.
- Better Pricing: A surge in sales for a
specific item implies demand is increasing and a price increase may be
reasonable, which improves profitability.
- Informed Supplier Negotiations: Since
companies earn 70% to 80% of their revenue on Class A items, it makes
sense to negotiate better terms with suppliers for those items. If the
supplier will not agree to lower costs, try negotiating post-purchase
services, down payment reductions, free shipping or other cost savings.
- Strategic Resource Allocation: ABC
analysis is a way to continuously evaluate resource allocation to ensure
that Class A items align with customer demand. When demand lowers,
reclassify the item to make better use of personnel, time and space for
the new Class A products.
- Better Customer Service: Service levels
depend on many factors, like quantity sold, item cost and profit margins.
Once you determine the most profitable items, offer higher service levels
for those items.
- Better Product Life Cycle
Management: Insights into where a product is in its life cycle
(launch, growth, maturity or decline) are critical for forecasting demand
and stocking inventory levels appropriately.
- Control Over High-Cost Items: Class A
inventory is closely tied to a company’s success. Prioritize monitoring
demand and maintaining healthy stock levels, so there’s always enough of
the key products on hand.
- Sensible Stock Turnover Rate: Maintain the
stock turnover rate at appropriate levels through methodical inventory
control and data capture.
- Reduced Storage Expenses: By carrying the
correct proportion of stock based on A, B or C classes, you can reduce the
inventory carrying costs that come with holding excess inventory.
- Simplified Supply Chain Management: Use an
ABC analysis of inventory data to determine if it’s time to consolidate
suppliers or shift to a single source to reduce carrying costs and
simplify operations.
What
is GMROI?
GMROI
stands for Gross Margin Return on Investment (aka. Gross Margin Return on
Inventory Investment). It is used to measure the amount returned on every
dollar invested in inventory.
For
example, if GMROI= 3 it means that for every dollar invested on inventory the
return is 3$.
What
Is the Gross Margin Return on Investment (GMROI)?
The gross
margin return on investment (GMROI) is an inventory profitability
evaluation ratio that analyzes a firm's ability to turn inventory into cash
above the cost of the inventory. It is calculated by dividing the gross margin
by the average inventory cost and is used often in the retail
industry. GMROI is also known as the gross margin return on inventory
investment (GMROII).
KEY
TAKEAWAYS
The
GMROI shows how much profit inventory sales produce after covering inventory
costs.
A
higher GMROI is generally better, as it means each unit of inventory is
generating a higher profit.
The
GMROI can show substantial variance depending on market segmentation, the
period, type of item, and other factors.
Understanding
the Gross Margin Return on Investment (GMROI)
The
GMROI is a useful measure as it helps the investor or manager see the average
amount that the inventory returns above its cost. A ratio higher than one means
the firm is selling the merchandise for more than what it costs the firm to
acquire it and shows that the business has a good balance between its sales,
margin, and cost of inventory.
The
opposite is true for a ratio below 1. Some sources recommend the rule
of thumb for GMROI in a retail store to be 3.2 or higher so that all occupancy
and employee costs and profits are covered.
How
to Calculate the Gross Margin Return on Investment (GMROI)

To
calculate the gross margin return on inventory, two metrics must be known: the
gross margin and the average inventory. The gross profit is calculated by
subtracting a company's cost of goods sold (COGS) from its revenue.
The difference is then divided by its revenue. The average inventory is
calculated by summing the ending inventory over a specified period and then
dividing the sum by the number of periods while considering the obsolete
inventory portion scenarios as well.
How
to Use the Gross Margin Return on Investment (GMROI)
For
example, assume luxury retail company ABC has a total revenue of $100 million
and COGS of $35 million at the end of the current fiscal year. Therefore, the
company has a gross margin of 65%, which means it retains 65 cents for each
dollar of revenue it has generated.
The
gross margin may also be stated in dollar terms rather than in percentage
terms. At the end of the fiscal year, the company has an average inventory cost
of $20 million. This firm's GMROI is 3.25, or $65 million / $20 million, which
means it earns revenues of 325% of costs. Company ABC is thus selling the
merchandise for more than a $3.25 markup for each dollar spent on inventory.
Assume
luxury retail company XYZ is a competitor to company ABC and has total revenue
of $80 million and COGS of $65 million. Consequently, the company has a gross
margin of $15 million, or 18.75 cents for each dollar of revenue it has
generated.
The
company has an average inventory cost of $20 million. Company XYZ has a GMROI
of 0.75, or $15 million/ $20 million. It thus earns revenues of 75% of its
costs and is getting $0.75 in gross margin for every dollar invested in
inventory.
This
means that company XYZ is making only $0.75 cents for each $1 spent on
inventory, which is not enough to cover business expenses other than inventory
such as selling, general, and administrative expense (SG&A), marketing, and
sales. For that XYZ margins are sub-standard. In comparison to company XYZ,
Company ABC may be a more ideal investment based on the GMROI.
How
to Calculate GMROI
GMROI
– Gross Margin Return on Inventory Investment – indicates how much
gross margin you get back for each dollar “invested” in inventory over a
year. Through careful analysis, you can see which lines, departments or
categories are the most rewarding for your inventory investment. And
which are least productive!
Here’s
the formula for calculating GMROI: (Use annual numbers; also, “Gross
Margin” is sometimes called “Gross Profit”)
GMROI
= Gross Margin $$ divided by Average Inventory @Cost
For
example, consider this merchandise category with annual sales of $130,000 at a
Gross Margin (or Gross Profit) of 49%
Gross
Margin $$ = $63,700 • Average Inventory @Cost = $40,625
GMROI
= $63,700 / $40,625 = $1.57
What
does this mean?
In
everyday language, it means that this retailer is getting back $1.57 in gross
margin for every $1.00 invested in inventory in this category for the year.
This
is a great tool! But, it becomes really powerful once you are able to
compare this category to the others in your store, and/or to last year.
he
Power of GMROI: Compare and Contrast!
Consider
this example. Which of these four departments is the most productive?

Well,
let's see.
Department
A has the highest sales (Gotta love a great top line!)
Departments
B and C have similar sales.
But
C has the highest margin.
So,
we repeat: Which department is the "best" for this
retailer?
Careful.
That can be answered only after we calculate the GMROI.
Here
are the GMROI calculations for each of these four departments. Revealing,
isn't it?
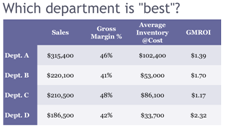
Department
D – admit it, sometimes overlooked because it has the lowest sales
and margin – is the productivity winner! It has the highest GMROI.
Its lower margin is offset by its higher inventory turns.
One
key takeaway to keep in mind: Sales and margin alone can’t really tell the
whole story.
Prefer
a "Down 'n Dirty" GMROI Formula?
Just
find the Gross Margin Dollars (of a department) for one full week. Then
multiply it by 52 weeks, and complete the calculation by dividing your current
on-hand inventory at cost into the "annualized" figure for Gross
Margin Dollars.
A
Practical Guide to Performance Management for Nonprofits
Performance
management for non-profits looks a little different. Employees live by certain
values, work for the greater good, and aren’t measured on profits. HR
departments at non-profits may struggle to run a traditional performance
management system.
A
Bridgespan Group survey showed that two-thirds of nonprofit organizations think
performance assessment is a weakness. If you look at all companies— for-profit
and non-profit —less than half say their performance management system
needs work.
So,
why do nonprofits struggle with performance management more than for-profit
businesses?
Nonprofits
have unique challenges. Many nonprofits have small HR departments.
These small departments have little time to build a performance management
process. Measuring employees’ performance can be difficult when profits aren’t
the main goal.
Though
performance management for nonprofits may be challenging, it isn’t
impossible. All you have to do is apply an approach that works for you.
Below,
you’ll find steps you can take to design a nonprofit performance
evaluation for your team. You can also see real-life examples of how
other nonprofits approach performance management. These examples can guide you
when you’re designing your performance management system.
The
right software makes it easy for small HR teams to run performance reviews.
Learn More
No comments:
Post a Comment